ci-health
![]()
This repo contains code to calculate metrics about the performance of CI systems based on Prow.
Definitions
-
Merge queue: list of Pull Requests that are ready to be merged at any given date. For being ready to be merged they must:
- Have the
lgtmlabel. - Have the
approvedlabel. - Not have any label matching
do-not-merge/*, i.e.do-not-merge/hold,do-not-merge/work-in-progressetc. . - Not have any label matching
needs-*, i.e.needs-rebase,needs-ok-to-testetc. .
- Have the
- Merge queue length: number of PRs in the merge queue at a given time.
- Time to merge: for each merged PR, the time in days it took since it entered the merge queue for the last time until it got finally merged.
- Retests to merge: for each merged PR, how many
/testand/retestcomments were issued after the last code push.
Status
This status is updated every 3 hours. The average values are calculated with data from the previous 7 days since the execution time.
kubevirt/kubevirt


Failures per SIG against last code push for merged PRs
These badges display the number of failures per SIG against merged PRs from the last 7 days.
Each of these failures contribute to the number of retests that occur in CI and delay the time to merge for PRs.


Quarantined Tests Per SIG
These badges display the number of tests that are currently quarantined per SIG.
More details on these tests can be found here


Top failed lanes:


The links to each of these failed jobs can be found in the latest execution data under the SIGRetests section
Historical data evolution
These plots will be updated every week.
-
kubevirt/kubevirt merge queue length:
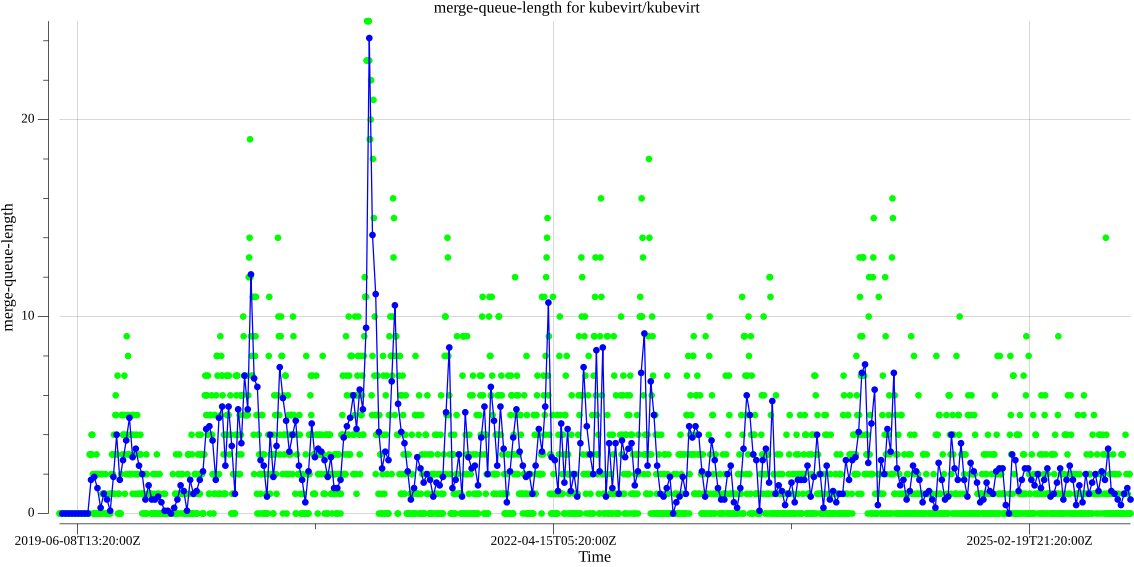
Data available here.
-
kubevirt/kubevirt time to merge:
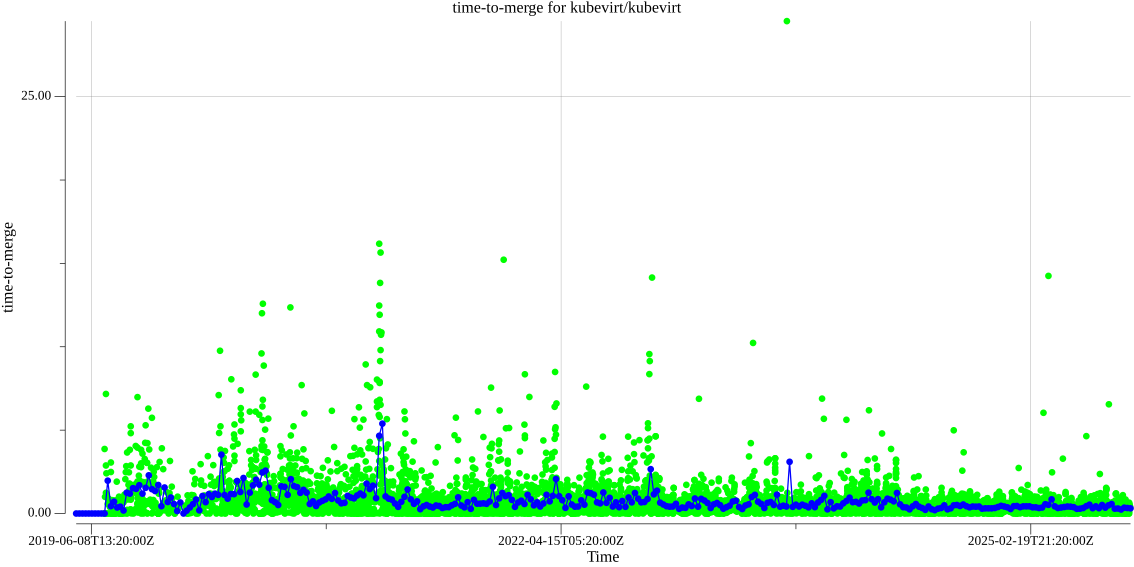
Data available here.
-
kubevirt/kubevirt retests to merge:
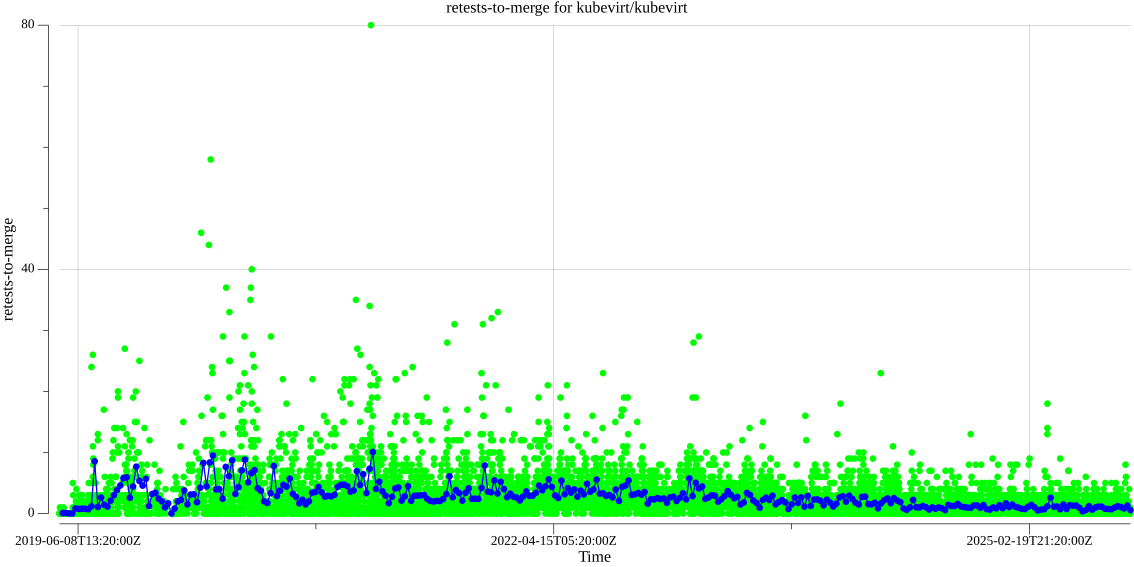
Data available here.
-
kubevirt/kubevirt merged PRs per day:
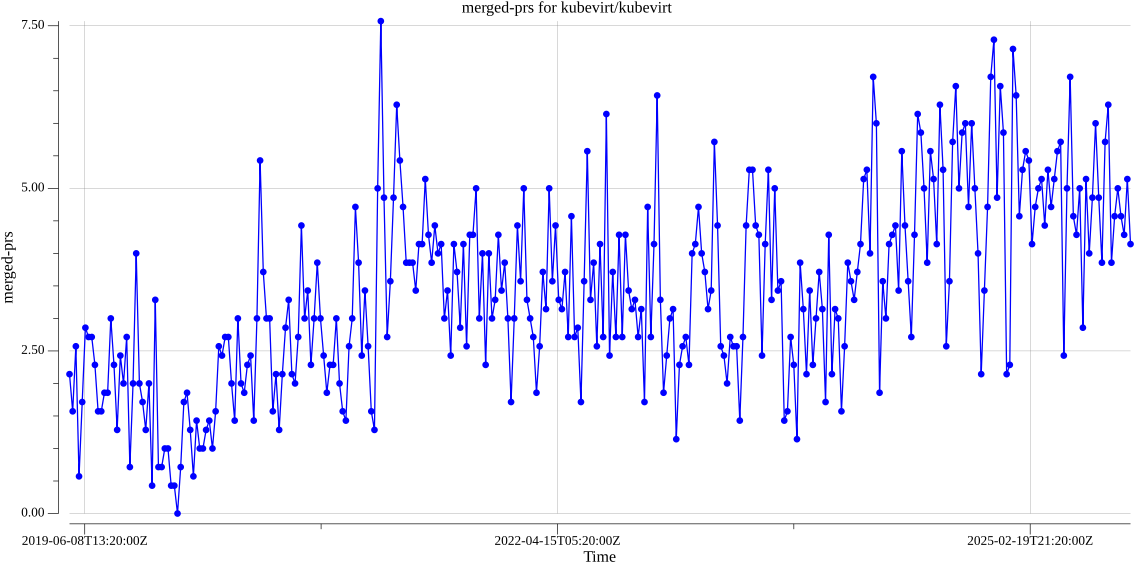
Data available here.
-
kubevirt/kubevirt quarantined tests over time (by SIG):
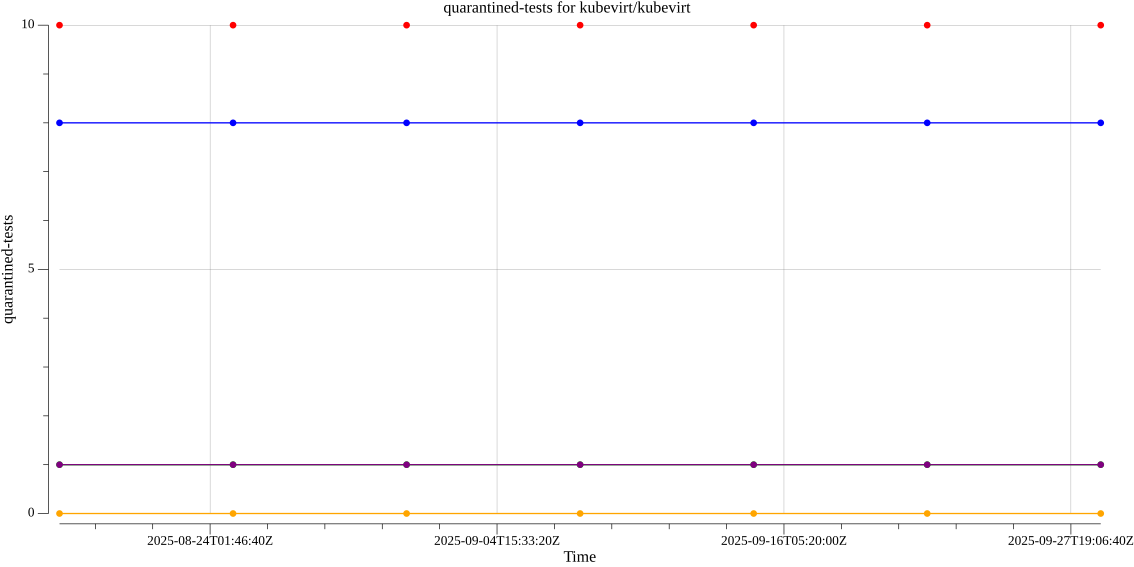
Legend: Red(Total) Blue(Compute) Green(Storage) Orange(Network) Purple(Monitoring) Data available here.
Commands
The tool has two different commands:
-
stats: gathers latest data and generates badges data and files. -
batch: gathers data for a range of dates and generates plots from them.
Local execution
You can execute the tool locally to grab the stats of a specific repo that uses Prow, these are the requirements:
- Go v1.22
- A GitHub token with
public_repopermission, it is required because the tool queries GitHub’s API
stats command
A generic stats command execution from the repo’s root looks like:
$ go run ./cmd/stats --gh-token /path/to/token --source <org/repo> --path /path/to/output/dir --data-days <days-to-query>
where:
--gh-token: should contain the path of the file where you saved your GitHub token.--source: is the organization and repo to query information from.--path: is the path to store output data.--data-days: is the number of days to query.
You can check all the available options with:
$ go run ./cmd/stats --help
So, for instance, if you have stored the path of your GitHub token file in a
GITHUB_TOKEN environment variable, a query for the last 7 days of
kubevirt/kubevirt can look like:
$ go run ./cmd/stats --gh-token ${GITHUB_TOKEN} --source kubevirt/kubevirt --path /tmp/ci-health --data-days 7
batch command
batch executions are done in two modes:
fetch: gathers the dataplot: generates a png file with the data previously fetched.
A generic fetch batch command execution from the repo’s root looks like:
$ go run ./cmd/batch --gh-token /path/to/token --source <org/repo> --path $(pwd)/output --mode fetch --target-metric merged-prs --start-date 2020-05-19
where:
--gh-token: should contain the path of the file where you saved your GitHub token.--source: is the organization and repo to query information from.--path: is the path to store output data.--target-metric: is the metric to query.--start-date: is the oldest date from which the data will be queried, until today.
You can check all the available options with:
$ go run ./cmd/batch --help
To generate plots you should execute:
$ go run ./cmd/batch --gh-token /path/to/token --source <org/repo> --path $(pwd)/output --mode plot --target-metric merged-prs --start-date 2020-05-19
Plot mode requires data previously generated by fetch mode.
html-report command
A command that generates HTML reports of test case failures per SIG. To create a report for SIG Compute failures:
go run ./cmd/html-report --sig compute --results-path ./output/kubevirt/kubevirt/results.json --path /tmp/
This should create a HTML report called sig-compute-failure-report.html under /tmp/.